Laboratory Information Management Systems (LIMS)
The idea behind LIMS
Every big laboratory uses a system to record which samples are received on a daily basis, which analyses are to be performed on those samples, and once done, what the results were to report back to the client who requested the tests. Sometimes LIMS go so far as to manage Invoicing and Purchasing for the processing of samples. The bit that sets a good LIMS apart is the ability to talk to laboratory equipment and automate certain tasks to save human hours.
LIMS for all...
As noted above, every big laboratory has one, typically some off-the-shelf system that does a great job overall. Sometimes you need a better-suited solution though, and we cater for those laboratories with specialized needs or specialized equipment and analyses, or perhaps the very small laboratories for whom a standard LIMS system is overkill, overly expensive, or perhaps simply not specialized enough - but they still need a system that offer full traceability and complies with laboratory regulations and accreditation requirements.
We could do the standard kind too - but we much prefer to hear from you if you have very tricky requirements!
A case in point...
A short example implementation at a specialized laboratory
This example implementation shows the inner workings at a client whom agreed to share their implementation detail in the Environmental monitoring industry.
(Please Note: The following example images are all from actual live systems, so some sensitive values are obscured here, but in the working systems they appear normal.)
The specific measurements compiled across three different methodologies allow them to report on complete Environmental factors for any geographical area:
- Weather data (Wind, Rainfall and Temperature) collected from autonomous Weather-station recorders placed on-site
- Particulate Pollutants measured over time in accumulation collectors and analyzed in their internal laboratory - notably Fall-out dust (PM25+)
- Chemical Pollutants measured over time in accumulation collectors and sent for Analysis to 3rd party laboratories - notably SO2
Bringing these vastly different types of analysis data together from different origins (Internal analysis, 3rd party analysis and Instrument logs) and producing coherent reports proved to be quite a challenge - but not an impossible one. To make things more interesting, a second requirement was to visualize the data on-line showing morphing meteorological patterns and pollution-affected geographical zones and levels animated over time, together with the usual downloadable reports and static level information.
The LIMS that could...
Collecting data, managing samples and connecting laboratory machine interfaces and importing remote downloads were all necessary and easy enough through standard compute interfaces. Some of the more advanced system features and resulting reports noted here:
First, a look inside the system...
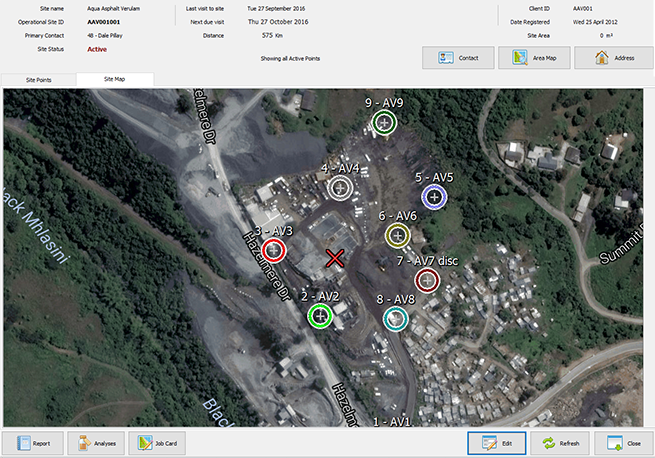
Data can be managed and viewed in "Raw" form at any time with full traceability and collection and analysis history for any Site or measurement point. A site is set up with Geographical positioning (GPS) markers for each measurement point or Instrument station. Analysis / Recorded data is then connected to the specific geolocations it originates from.
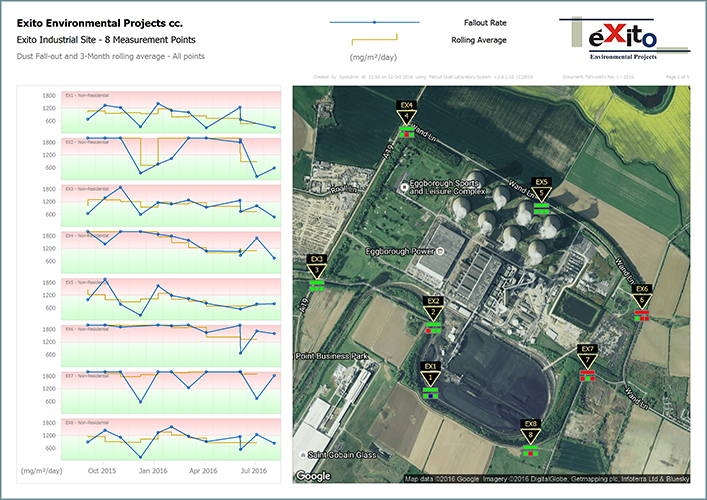
Showing a defined Geographical Site with specific Measurment points and center marker:
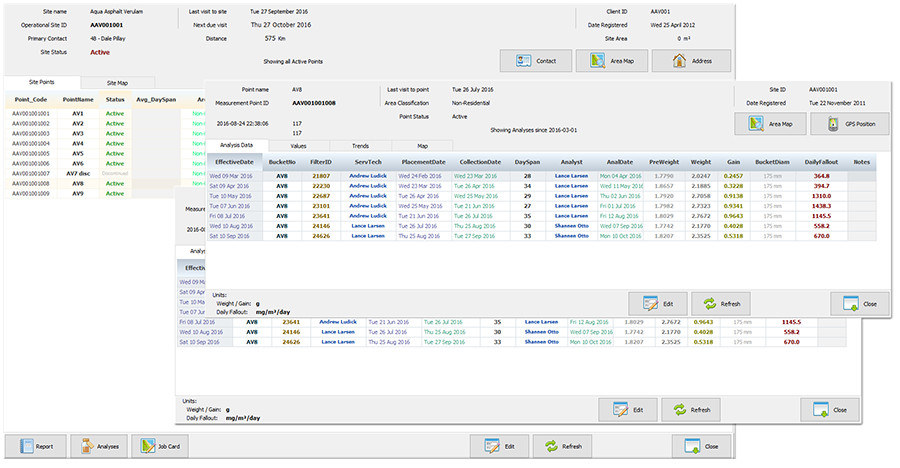
Showing point-data history and tracking from some measurement points selected from the Site:
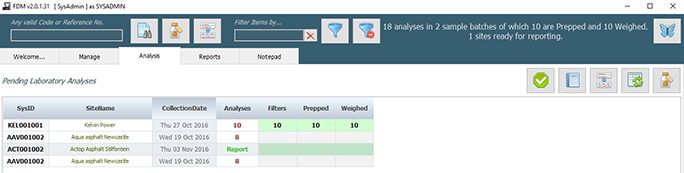
Showing analyses being prepared, in-process or completed and ready to be reported on:
Reporting sections
A static report is made up of various smaller report-sheets showing data and graphing for specific points in the areas. These typically include:
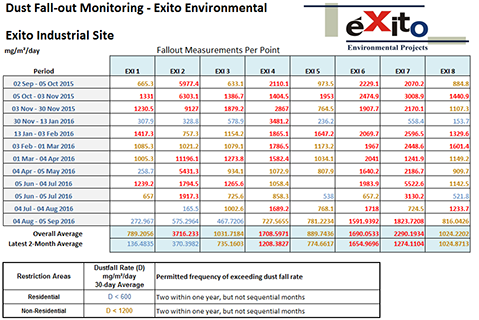
Long-term aggregate of the data values for points in an area:
Long-term aggregate graph for the points in an area:
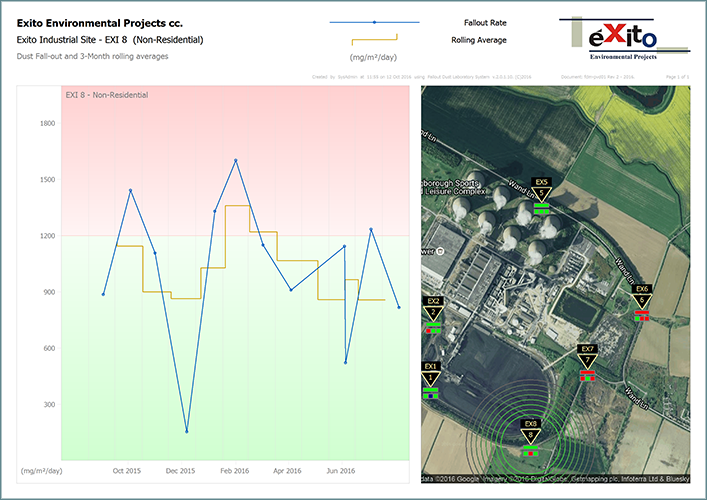
Direct long-term progression of a single Point:
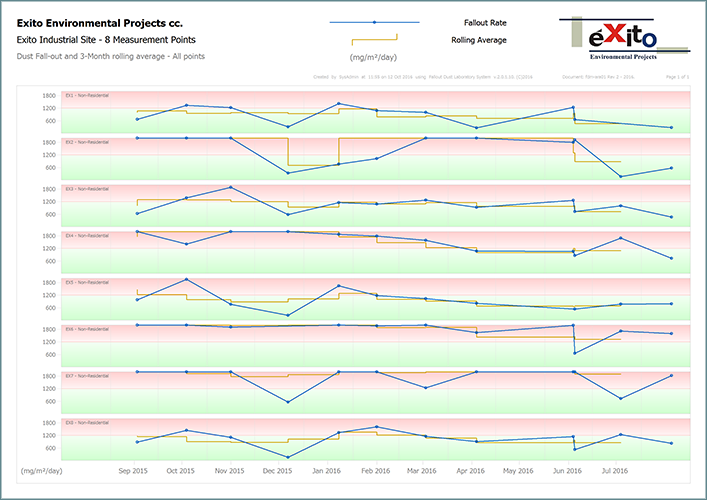
Aggregate of all points with rolling average and over-range warning indicators:
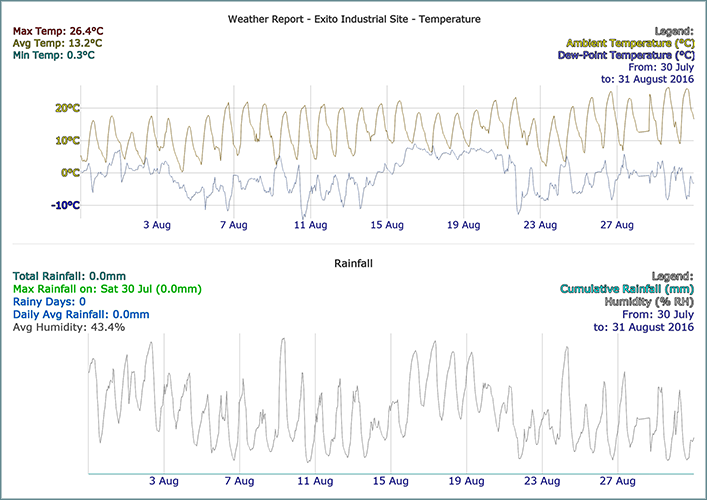
Temperature and Rainfall statistics:
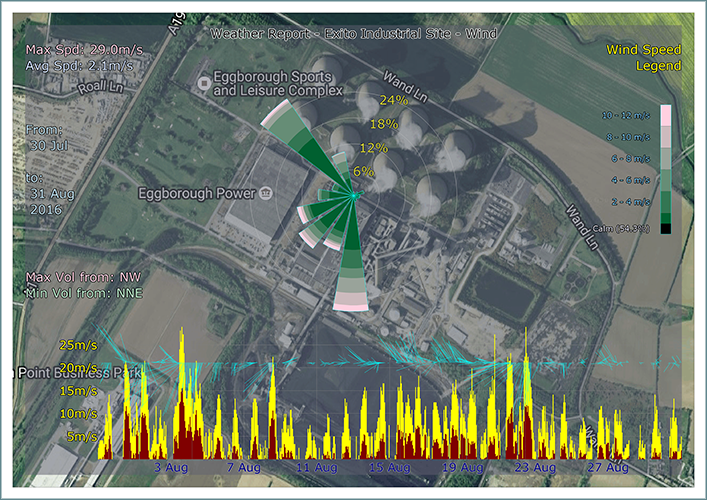
Wind speed, direction and Volume over time and aggregate (Wind-Rose):
On-Line Reporting and Visualization
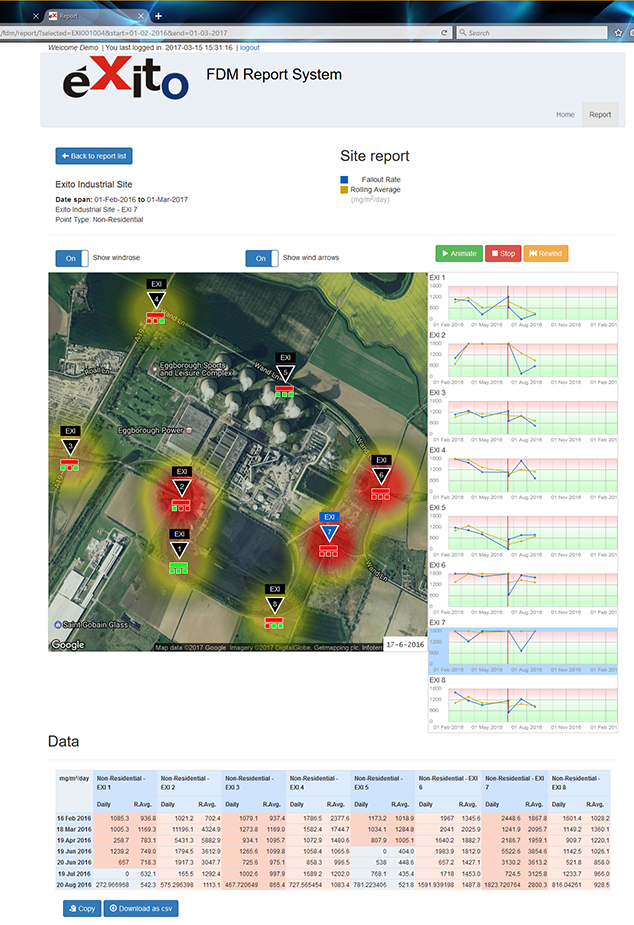
Once the static report is completed, it is uploaded and available form the Web Portal. An example report can be down-loaded via this link.
Example of Web-View of an active Site and polution map visualization:
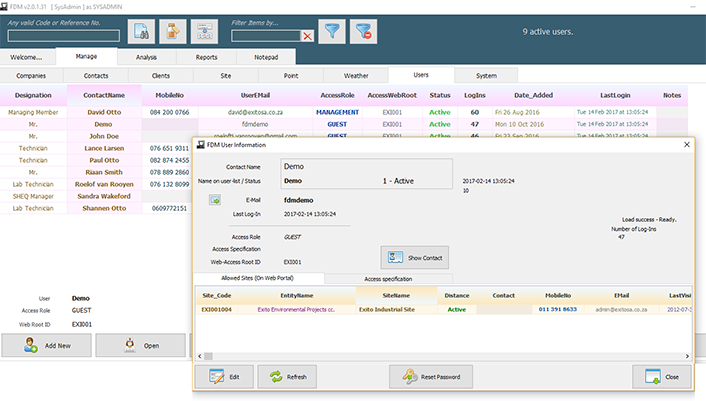
Users from clients may be added to the system with specific rights to view their respective Sites: